sphinxcontrib-actdiag
sphinxcontrib-actdiag is a Sphinx extension for embedding actdiag diagrams. You can embed activity diagrams with the actdiag directive.
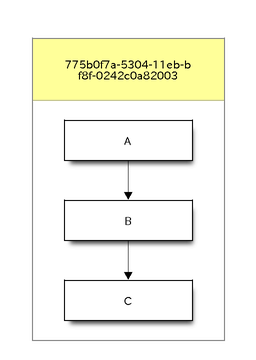
.. actdiag::

    actdiag admin {
      A -> B -> C;
    }
Setting
You can get archive file at http://bitbucket.org/birkenfeld/sphinx-contrib/
Install
$ pip install sphinxcontrib-actdiag
Configure Sphinx
To enable this extension, add sphinxcontrib.actdiag module to extensions
option at conf.py.
# Enabled extensions
extensions = ['sphinxcontrib.actdiag']

# Fontpath for actdiag (truetype font)
actdiag_fontpath = '/usr/share/fonts/truetype/ipafont/ipagp.ttf'
Note
If you write documents including multibyte characters, you have to set fontpath to actdiag_fontpath.
Directive
-
.. actdiag:: [filename] This directive inserts a activity diagram into the document. When the filename argument is specified, the extension reads the diagram definition from the specified file. Otherwise, it reads the diagram definition from the code block.
Examples:
.. actdiag:: foobar.diag

.. actdiag::

   actdiag {
      // some diagrams are here.
   }
In addition, the following options are recognized:
alttextAlternate text: a short description of the diagram, displayed by applications that cannot display diagram.
heightlengthThe desired height of the diagram. When the “scale” option is also specified, they are combined. For example, a height of 200px and a scale of 50 is equivalent to a height of 100px with no scale.
widthlengthThe width of the diagram. As with “height” above, when the “scale” option is also specified, they are combined.
scaleinteger percentageThe uniform scaling factor of the image. The default is “100%”, i.e. no scaling.
maxwidthlengthDeprecated since version 0.7.0: Use
widthoption.Same as “width” option.
align“left”, “center” or “right”The horizontal alignment of the diagram.
captiontextThe caption of the diagram.
desctable:Description Table: a table that describes each diagram elements (cf. nodes, edges) When this option is specified, Sphinx generates Description Table from diagram, corrects descriptons from description attribute of each node and edges.
Example:
.. actdiag::
   :desctable:

   actdiag {
      A -> B -> C;
      A [description = "browsers in each client"];
      B [description = "web server"];
      C [description = "database server"];
   }
Generated:
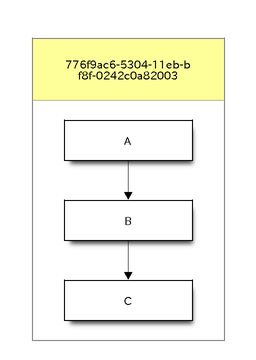
Name
Description
A
browsers in each client
B
web server
C
database server
figwidth“image”, lengthThe width of the figure. A special value of “image” is allowed, in which case the included diagram’s actual width is used.
figclasstextSet a classes attribute value on the figure element.
nametextSet a names attribute value on the diagram-image element. This allows hyperlink references to the diagram using text as reference name.
classtextSet a classes attribute value on the diagram-image element.
Configuration File Options
-
actdiag_fontpath = str or list of str¶ The paths to truetype fonts. actdiag_fontpath option accepts both single path string and list of paths.
New in version 0.1.1: actdiag_fontpath accepts fontpath list
-
actdiag_fontmap = str¶ The path to fontmap definitions.
-
actdiag_antialias = bool¶ Render diagrams in antialias mode or not.
-
actdiag_transparency = bool¶ Render diagrams as transparency or not.
New in version 0.8.0.
-
actdiag_html_image_format = "PNG" or "SVG"¶ The output image format at generating HTML docs.
-
actdiag_latex_image_format = "PNG" or "PDF"¶ The output image format at generating PDF docs (through LaTeX). When a value of “PDF” is specified, you can get clear diagram images. In which case, reportlab library is required.
-
actdiag_tex_image_format = "PNG" or "PDF"¶ Deprecated since version 0.7.0: Use
actdiag_latex_image_formatoption.Same as “actdiag_latex_image_format” option.
-
actdiag_debug = bool¶ Enable debug mode of actdiag.